Appearance
Query editor
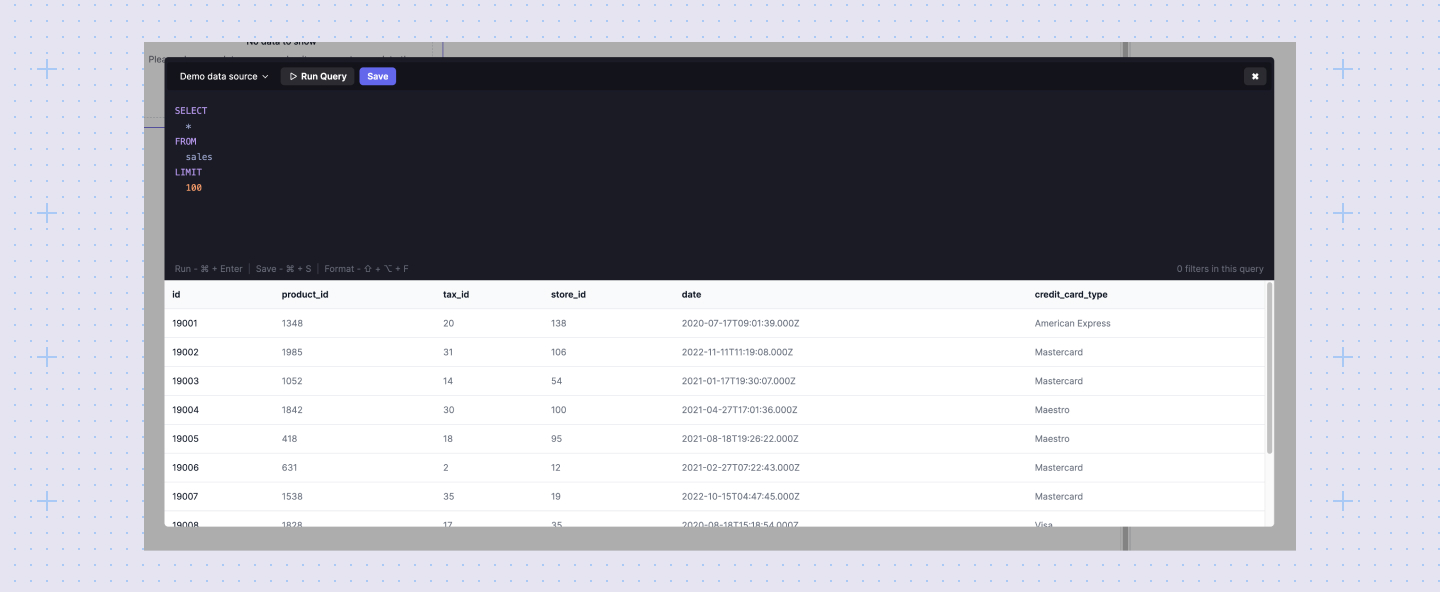
Sumboard's query editor allows you to analyze your data from various sources, including SQL databases, NoSQL databases, and APIs.
Executing queries
The results table offers a preview of your data, showcasing up to the first 10 rows.
In editor, you can:
- Run the query (cmd+enter) to see the results.
- Format the query using cmd+f hotkey.
- Save (cmd+s) the query if you're satisfied with the results and it will apply the data to the chart.
WARNING
Warning: Executing an uncached SQL query directly interacts with your database. To optimize performance and avoid unnecessary database calls, consider enabling caching.
Applying filters
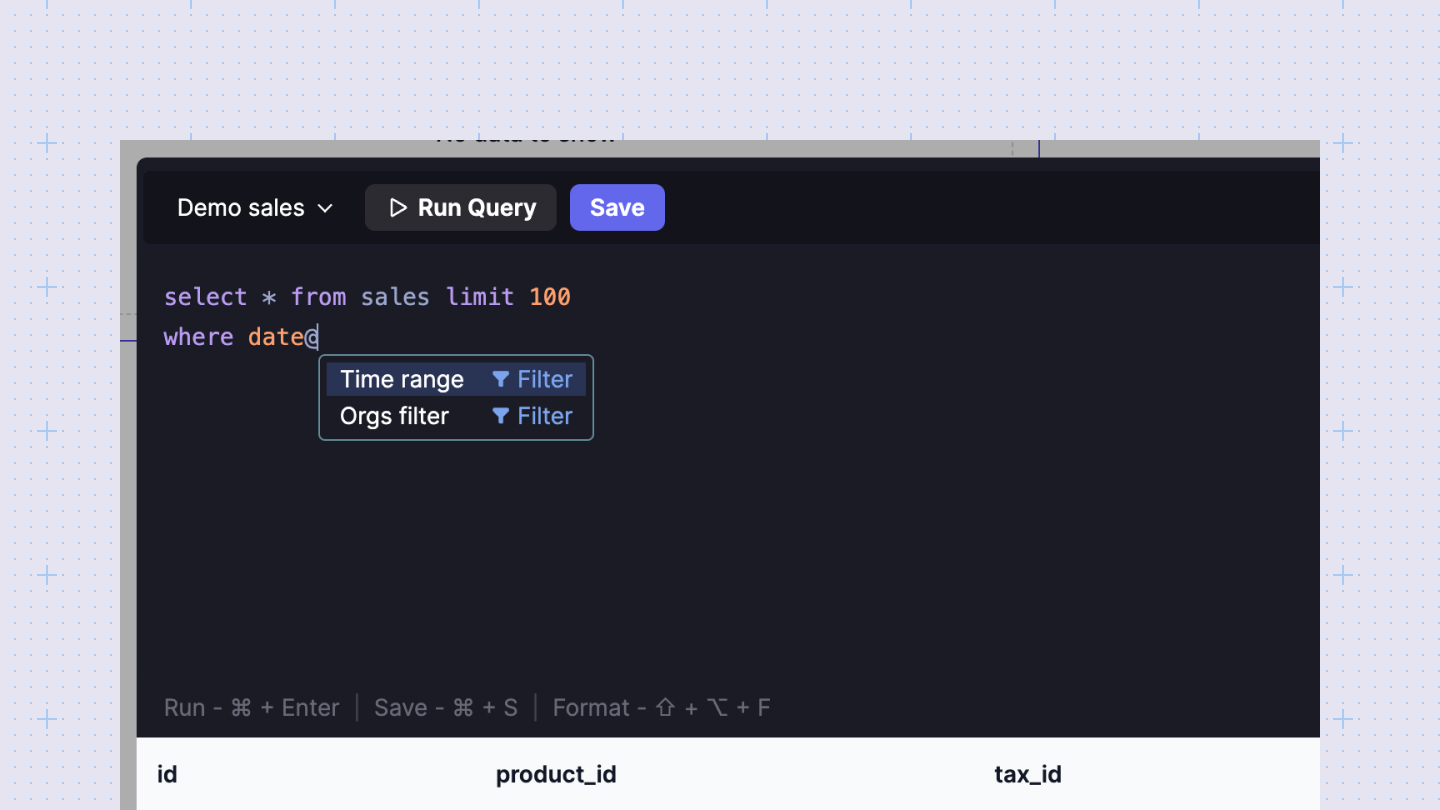
Filters allow you to refine your data view and create interactive dashboards. Here's how to apply filters in your queries:
- Use the
@hotkey within the query editor to reveal a list of filter keys available to your organization. - Choose the filter key relevant to the specific chart you're creating.
Here's an example where we apply a time_range filter:
sql
SELECT
  created_at
FROM
  users
WHERE {created_at:time_range}
In this example, WHERE {created_at:time_range} incorporates the time_range filter, enabling users to filter data based on the created_at column.
Error handling
The query editor helps identify and display errors in your SQL requests. If a query references a column that doesn't exist in the data source, the editor will flag an error. Syntax erros also will be highlighted.