Appearance
Reports
Reports are documents generated based on your dashboards, which can be downloaded directly or sent via email using Schedules. Sumboard offers three types of reports:
- Excel
- Image
Excel
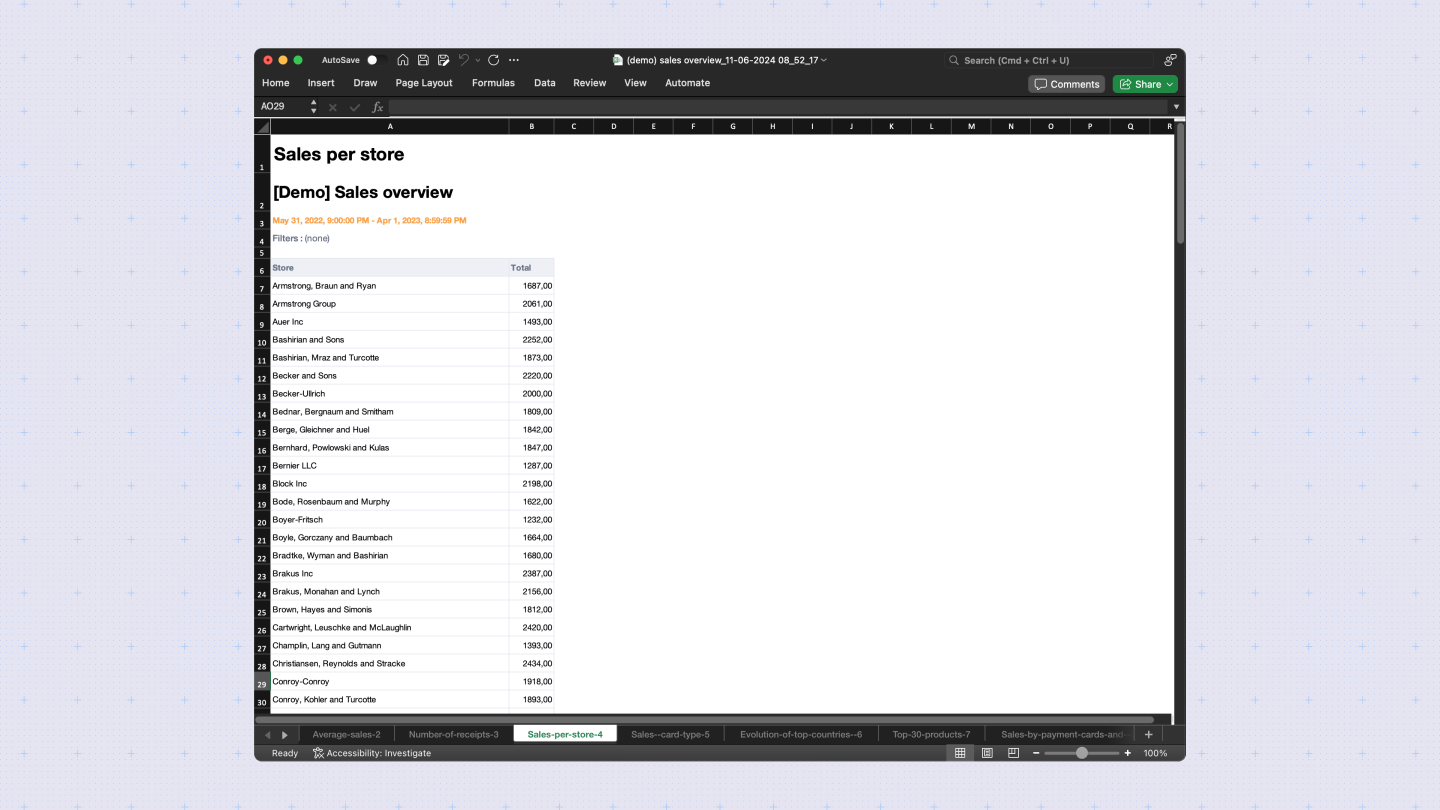
When creating an Excel report from a dashboard, each chart is exported to its own worksheet, named after the chart. The file name will include the dashboard name and the generation time. By default, the Excel report will not include images but will list the applied filters and the generation date.

For Excel exports, we support the compare feature. If compare is enabled, the generated Excel file will include the comparison data in a new tab.
Excel reports can be customized in Workspace settings to align with your brand guidelines and specific requirements.
PDF
Export a dashboard as a PDF. The resulting dashboard will be a snapshot of what's visible in the dashboard at the time of export.
By default it will show dashboard name and sumboard logo only on the first page. Chart name, applied filters and generation date on each page. You can add a custom logo and change the PDF settings as page size, layout and font size in the Export settings.

Image
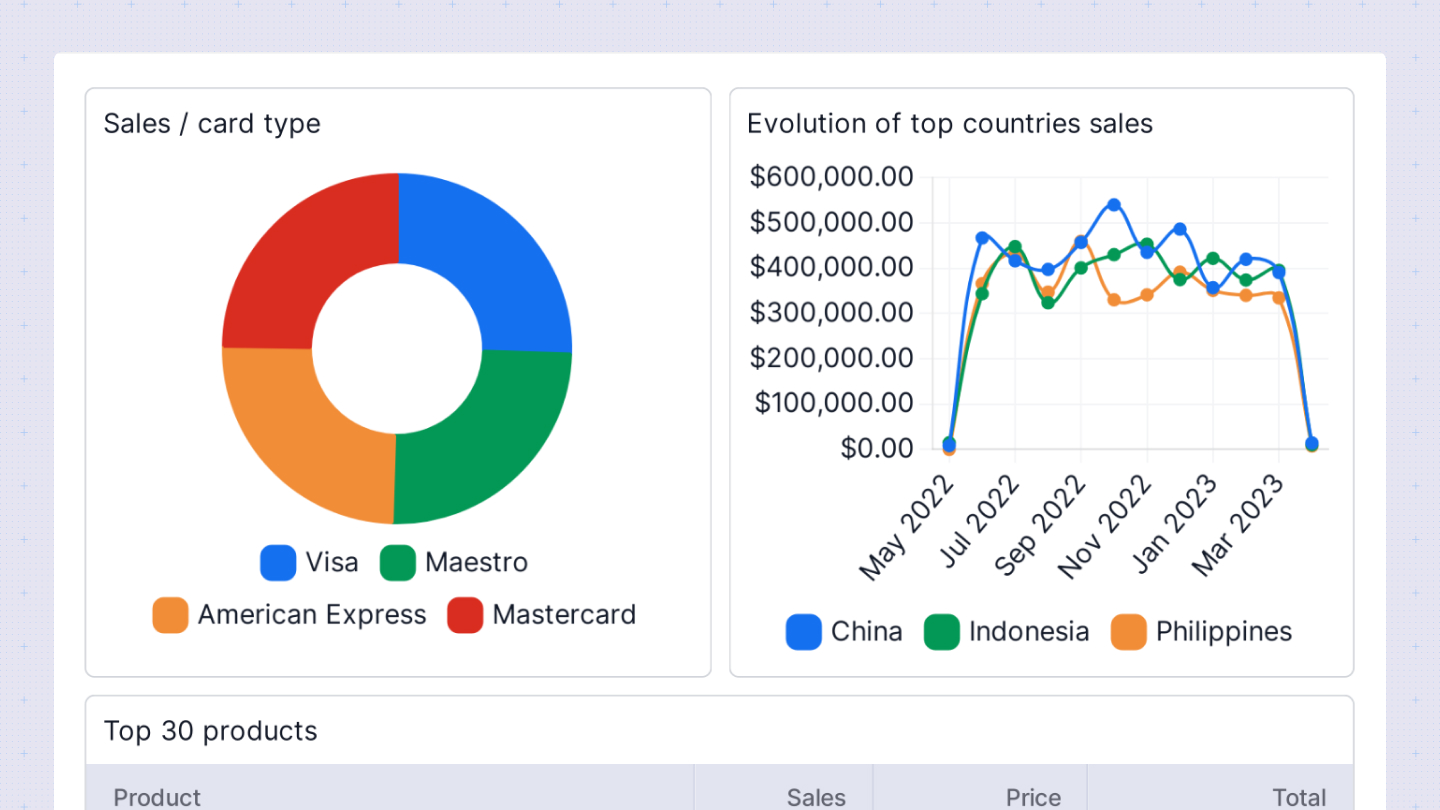
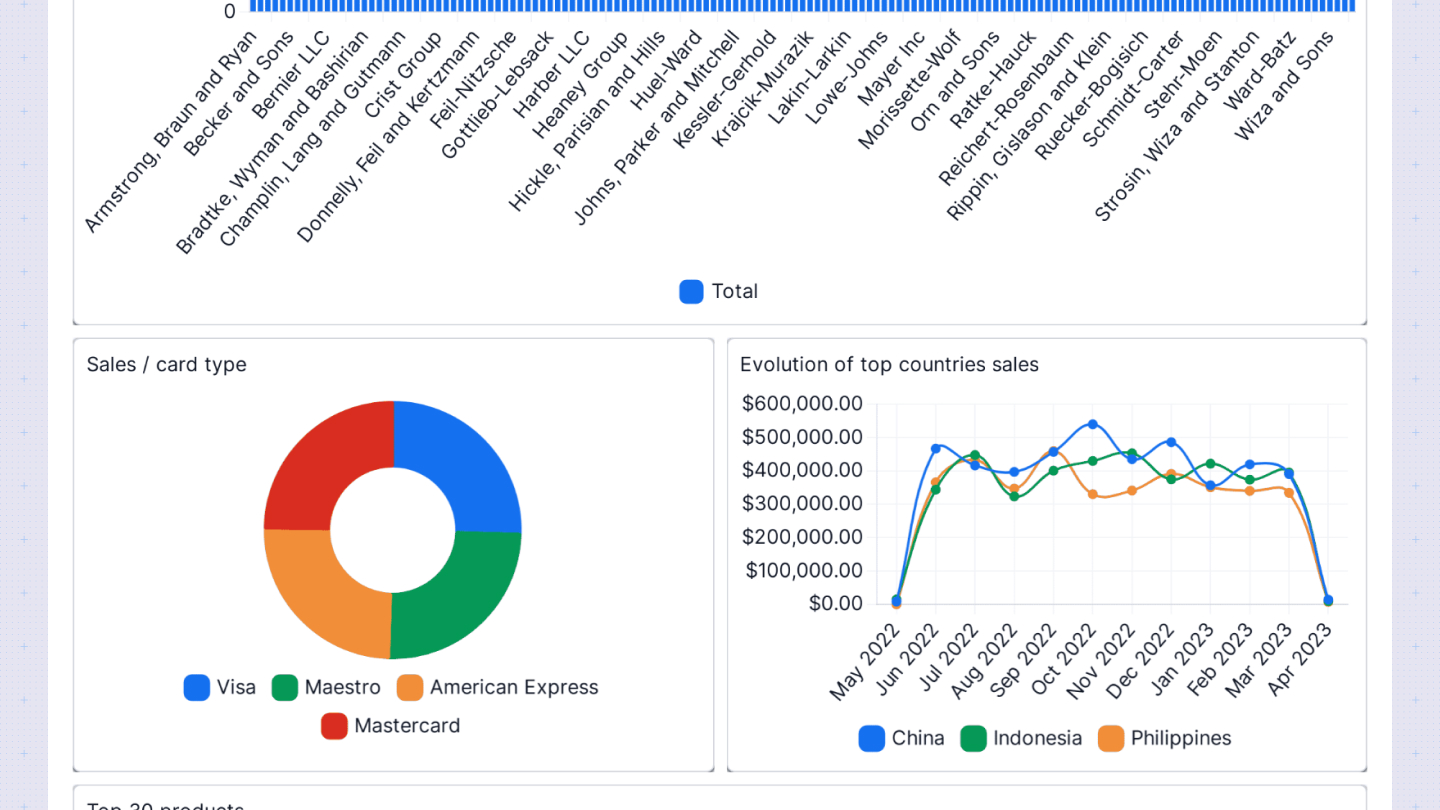
In case of image, it will take a screenshot of the entire dashboard or an individual chart.

INFO
Both PDF and Excel reports can be customized in Workspace settings to align with your brand guidelines and specific requirements.