Appearance
Text Chart

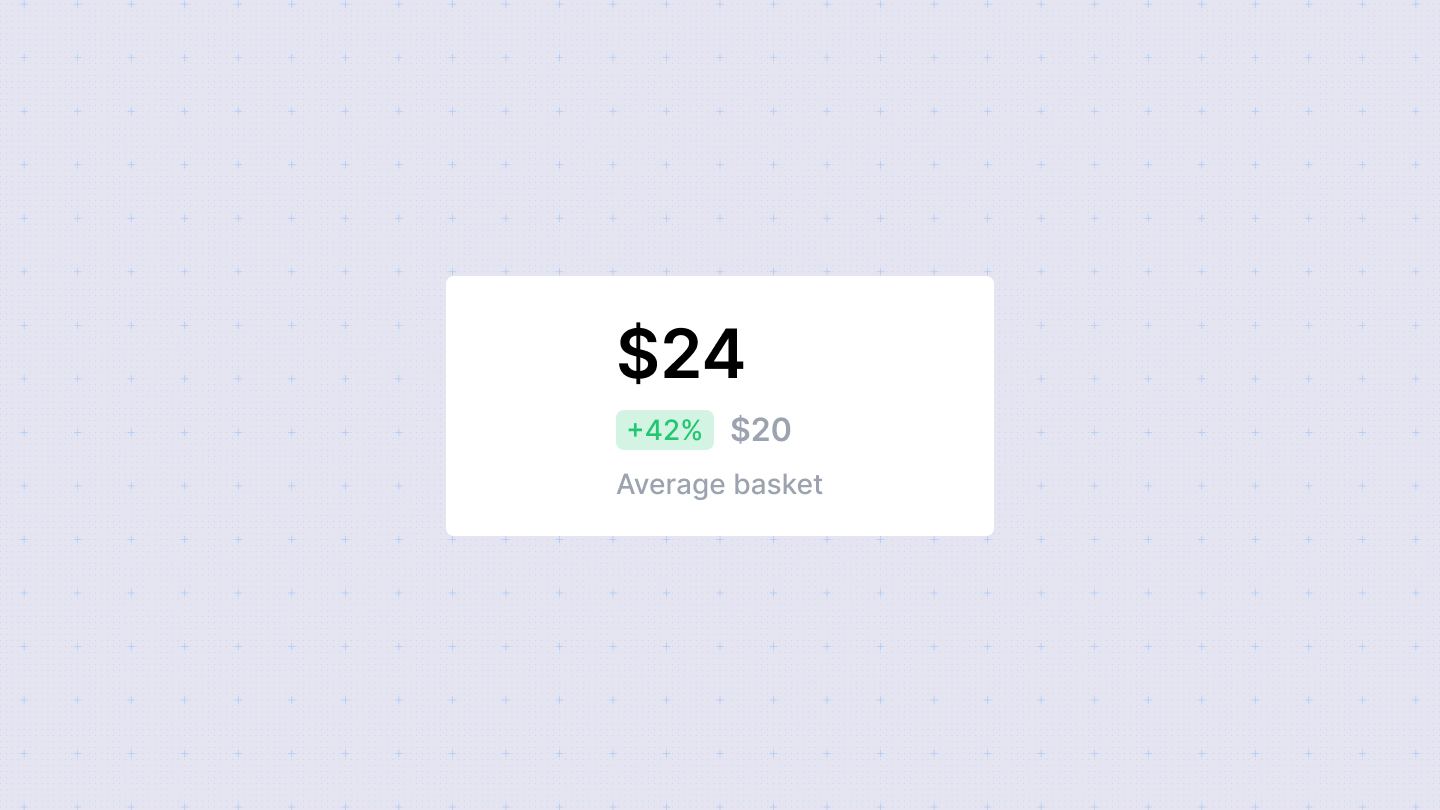
The Text chart in Sumboard allows you to create custom visualizations using HTML and inline CSS. It is particularly useful for displaying textual information, dynamic content, or data summaries in a visually appealing format. Use the Text Chart when you need to present data creatively using HTML and CSS within your Sumboard dashboards.
Usage
To create a Text Chart:
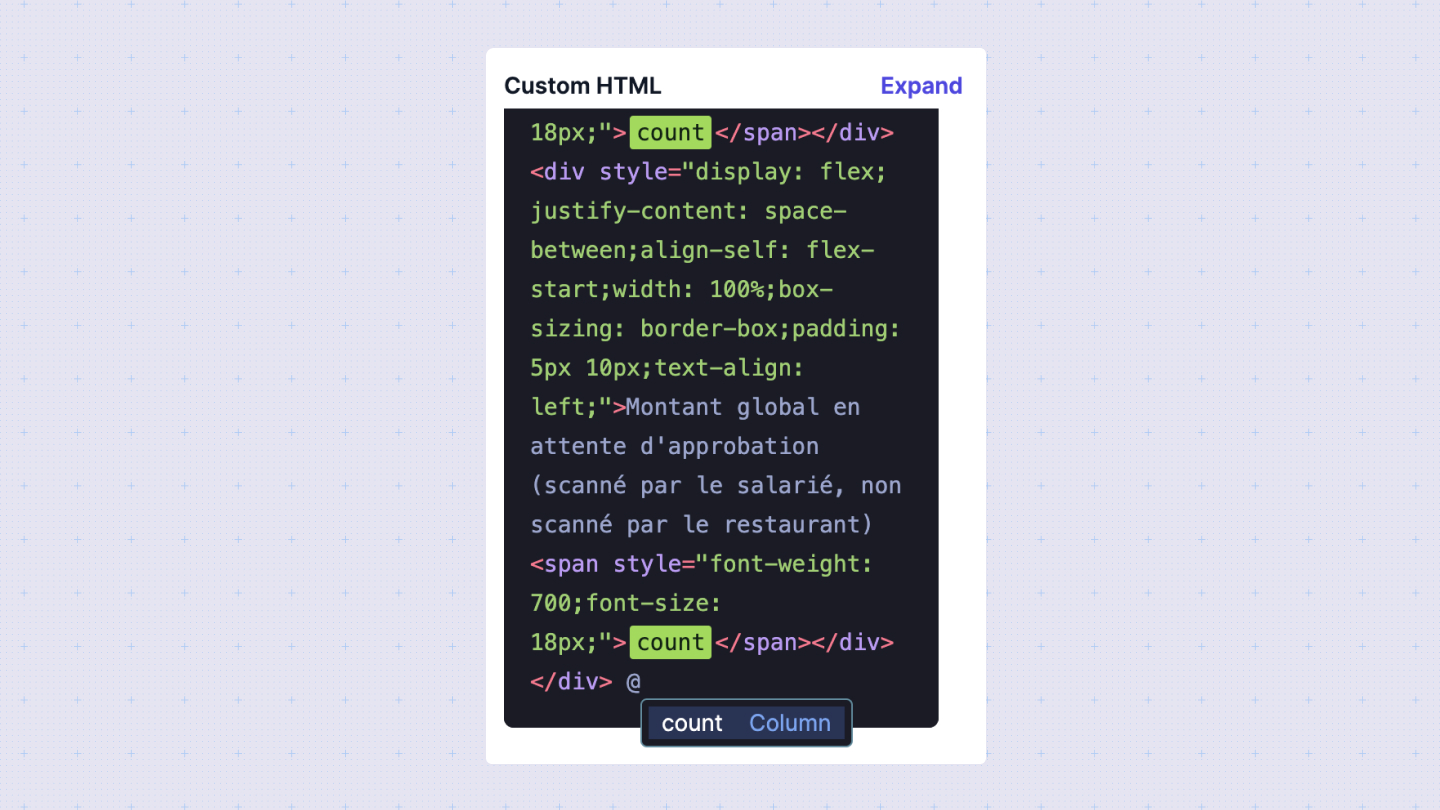
- HTML and Inline CSS: Write your HTML code directly in Sumboard's editor. Use inline CSS for styling to customize the appearance of your custom visualization.
- Query integration: Reference columns from your query data to dynamically populate your text chart with relevant data.
To insert a column in the HTML editor, simply use the "@" hotkey and select the desired column from the menu.
